In order to effectively work towards our environmental goals we have defined our ‘peak program’. This program helps us to work towards our Faber Development Goals – Climate Action (13), Responsible Consumption (12) and Partnerships (17).

Reducing
our footprint


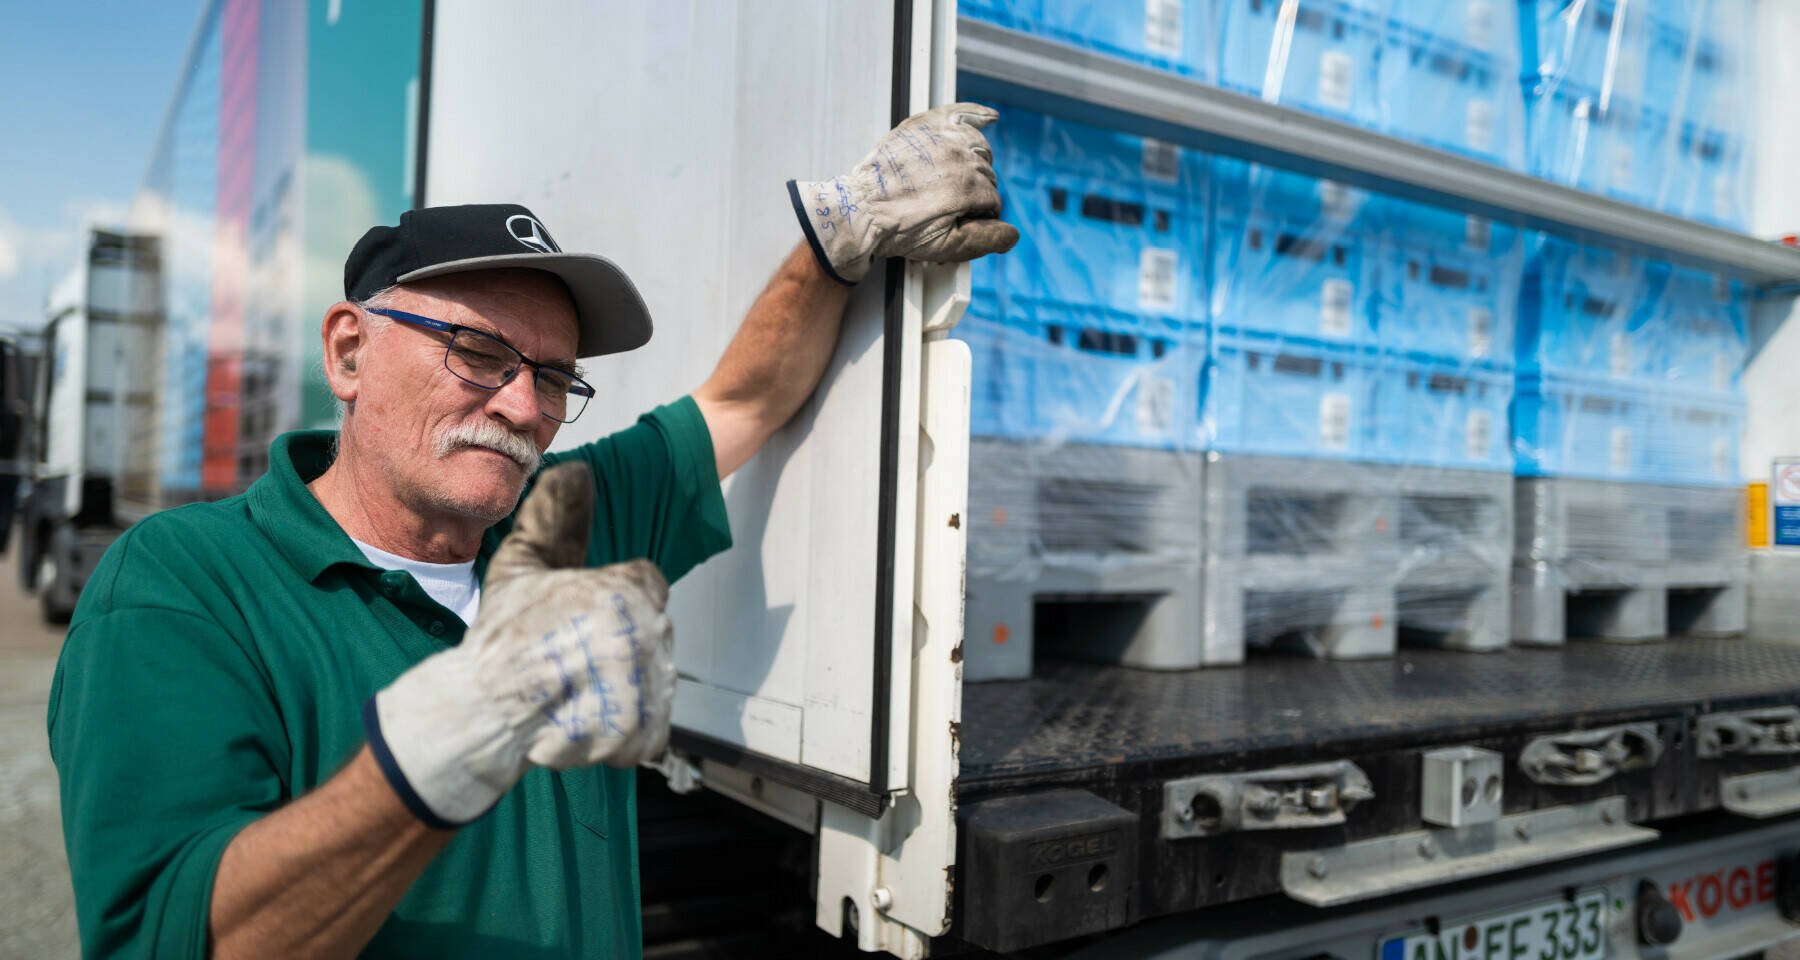
By making our load carriers traceable we increase recovery and sustainability

Our goal | Projects | |
|---|---|---|
Impact Area 1 & 2: | Increase the amount of CO2 emissions we avoid in the supply chain of our customers. These avoided emissions we call our ‘avoided emissions/Scope 4’ impact: we want to maximize the carbon savings that our customers realize by choosing a pooling system instead of using a less sustainable alternative (such as one-way pallets). | – Growing our business and help customers make use of pooling instead of less sustainable alternatives such as one-way load-carriers. |
Impact area 3: | Improving efficiency, switch to cleaner transport types, but also by optimizing our transport network. | – PAKi’s empty run prevention initiative. |
Impact area 4: | Depot partners play a vital role in our supply chain. These partners store, sort & repair our load-carriers. Our goal is to help depots in becoming more sustainable and reduce their footprint. | – Assessing our (depots) suppliers on their sustainability performance. |
Impact area 5: | We believe partnerships and circularity are key to offering our customers an effective and sustainable pooling network. That is why we are creating a sustainable and ethical supply chain with strong suppliers and partners. We do this by stimulating our (new) suppliers to act and improve on sustainability and social topics but also by sourcing in a sustainable manner | – Groupwide project to make sustainability integrated part of the procurement process and decision making. |
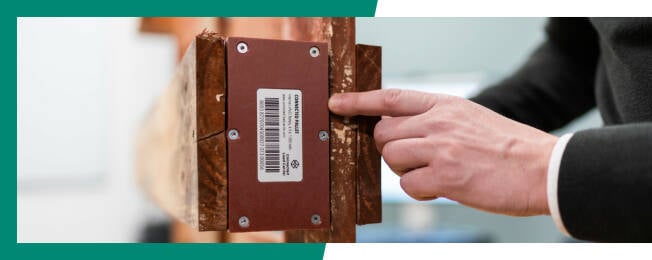
Impact area 6: | Improving pallet lifespan is key to our sustainability. By enhancing repair and reusability, we boost performance. Digitalizing assets with Connected Load Carrier helps track and optimize supply chains, reducing loss. Unique identifiers like RFID, QR, and barcodes further enhance control over pallet usage and location. | – PRS green label, which stimulates pallet recovery with converters. |
Impact area 7: | Even while we are extending the lifetime of load-carriers, they will reach the end of their life span eventually. It is our goal to make sure these decommissioned load-carriers are processed in the best way possible. | |
Other sustainability | Next to our peak program we want to maintain a high standard of reducing the environmental impact of our supporting activities, such as our office buildings and car fleet. Also, we contribute to a more sustainable world via donating to tree planting initiatives. Via these initiatives we offset a part of our carbon footprint. | – Work towards sustainable and carbon-neutral supporting activities (which include our offices, lease cars, commuting of our employees and sustainable procurement of office related supplies). |

Peak Program
As Our Peak Program is two-folded, first focus is to increase Scope 4 (impact area 1 & 2) and secondly, we want to decrease Scope 1,2 and 3 (impact area 3 - 7). Each Impact Area delivers a contribution to at least one of the Faber Development Goals.
The Peak Program contains seven impact areas that enable the organization to minimize the carbon footprint, maximizing reuse and engaging in strategic partnerships to reach the sustainability targets. The overview on the next page shows the progress per impact area. A more detailed description of the projects can be found in the sustainability report of 2022.


Absolute carbon footprint over 2023
Footprint per division
As can be seen in the graphs, we have realized an overall lower footprint for our divisions PRS, PAKi and Satim, but an increase in absolute CO2 emissions for IPP and vPOOL. Especially for Satim the reduction is significant, this is mainly the result of less wood procurement activities in comparison to previous years.
Since we are growing in number of trips and business, it is important to not only look at the absolute footprint, but also look at the footprint per unit (per trip, barter or m3 wood). This is a better indicator for the improvements we realize in our value chain. For PAKi, IPP and vPOOL this is currently stabilized in comparison to the previous years, for PRS we see a decrease in the footprint per trip and for Satim a significant increase in footprint per delivered m3 wood. The main reason for the increase at Satim is the longer distances trucks needed because new wood logging locations where selected in for example northern Scandinavia due to the Ukraine war.
Our carbon footprint 2023
As indicated in the two pie charts –which is a breakdown of our total footprint for 2023– the main impact is caused by the production of new load carriers and transport (upstream and downstream). Only a very small percentage comes from scope 1 and 2 and supporting activities, such as our offices.
As the potential footprint reduction in transport is obvious, it is important to emphasize there is substantial potential in footprint reduction by lowering the need to purchase new load carriers. This can be done by optimizing the usage of the existing load carrier pool (by increasing rotation speed of load carriers and by avoiding loss through digitalization and traceable load carriers) and by optimizing the life span (through proper care, repair, and maintenance). The less new load carriers we need to purchase, the less our impact on the need of timber or other materials to produce them.


Scope 3: All other indirect emissions. Emitted in the value chain of the organisation. A distinction is made between upstream and downstream emissions.
Scope 2: Indirect emissions. The carbon emissions that are caused by generating electricity that we purchase and use in our own office buildings or company cars.
Scope 1: The direct emissions. These emissions are generated by our office buildings and company cars. Examples are gas usage for heating and fuel consumption of company cars.
We mapped all relevant GHG protocol categories in our business model, which are visualized in the overview below. In this overview we make an distinguishment between supporting activities (which are our office and employees) and the pooling activities.
One of our focus points in improving the data quality of our environmental data. To do so we are continuously working on getting more accurate and representative data. One of the ways to do is by performing an yearly internal audit team on the sustainability data, which gives us good input to continuously work on data quality improvements. Last year we improved our data based on the LCAs we have performed, also our base year calculations have been slightly adjusted based on these renewed insights.
Our impact
The last three years we have measured our groupwide footprint for all three scopes of the Greenhouse Gas Protocol (GHG). Next we are also working on the quantification of our Scope 4, this is being done with the support of comparative Life Cycle Assessments of our main load-carrier services. The results of these LCA’s can be found in chapter 4 of this report.


In order to effectively work towards our environmental goals we have defined our ‘peak program’. This program helps us to work towards our Faber Development Goals – Climate Action (13), Responsible Consumption (12) and Partnerships (17).
Reducing
our footprint

By making our load carriers traceable we increase recovery and sustainability

Our goal | Projects | |
|---|---|---|
Impact Area 1 & 2: | Increase the amount of CO2 emissions we avoid in the supply chain of our customers. These avoided emissions we call our ‘avoided emissions/Scope 4’ impact: we want to maximize the carbon savings that our customers realize by choosing a pooling system instead of using a less sustainable alternative (such as one-way pallets). | – Growing our business and help customers make use of pooling instead of less sustainable alternatives such as one-way load-carriers. |
Impact area 3: | Improving efficiency, switch to cleaner transport types, but also by optimizing our transport network. | – PAKi’s empty run prevention initiative. |
Impact area 4: | Depot partners play a vital role in our supply chain. These partners store, sort & repair our load-carriers. Our goal is to help depots in becoming more sustainable and reduce their footprint. | – Assessing our (depots) suppliers on their sustainability performance. |
Impact area 5: | We believe partnerships and circularity are key to offering our customers an effective and sustainable pooling network. That is why we are creating a sustainable and ethical supply chain with strong suppliers and partners. We do this by stimulating our (new) suppliers to act and improve on sustainability and social topics but also by sourcing in a sustainable manner | – Groupwide project to make sustainability integrated part of the procurement process and decision making. |
Impact area 6: | Improving pallet lifespan is key to our sustainability. By enhancing repair and reusability, we boost performance. Digitalizing assets with Connected Load Carrier helps track and optimize supply chains, reducing loss. Unique identifiers like RFID, QR, and barcodes further enhance control over pallet usage and location. | – PRS green label, which stimulates pallet recovery with converters. |
Impact area 7: | Even while we are extending the lifetime of load-carriers, they will reach the end of their life span eventually. It is our goal to make sure these decommissioned load-carriers are processed in the best way possible. | |
Other sustainability | Next to our peak program we want to maintain a high standard of reducing the environmental impact of our supporting activities, such as our office buildings and car fleet. Also, we contribute to a more sustainable world via donating to tree planting initiatives. Via these initiatives we offset a part of our carbon footprint. | – Work towards sustainable and carbon-neutral supporting activities (which include our offices, lease cars, commuting of our employees and sustainable procurement of office related supplies). |

Peak Program
As Our Peak Program is two-folded, first focus is to increase Scope 4 (impact area 1 & 2) and secondly, we want to decrease Scope 1,2 and 3 (impact area 3 - 7). Each Impact Area delivers a contribution to at least one of the Faber Development Goals.
The Peak Program contains seven impact areas that enable the organization to minimize the carbon footprint, maximizing reuse and engaging in strategic partnerships to reach the sustainability targets. The overview on the next page shows the progress per impact area. A more detailed description of the projects can be found in the sustainability report of 2022.


Footprint per division
As can be seen in the graphs, we have realized an overall lower footprint for our divisions PRS, PAKi and Satim, but an increase in absolute CO2 emissions for IPP and vPOOL. Especially for Satim the reduction is significant, this is mainly the result of less wood procurement activities in comparison to previous years.
Since we are growing in number of trips and business, it is important to not only look at the absolute footprint, but also look at the footprint per unit (per trip, barter or m3 wood). This is a better indicator for the improvements we realize in our value chain. For PAKi, IPP and vPOOL this is currently stabilized in comparison to the previous years, for PRS we see a decrease in the footprint per trip and for Satim a significant increase in footprint per delivered m3 wood. The main reason for the increase at Satim is the longer distances trucks needed because new wood logging locations where selected in for example northern Scandinavia due to the Ukraine war.

Absolute carbon footprint over 2023

Our carbon footprint 2023
As indicated in the two pie charts –which is a breakdown of our total footprint for 2023– the main impact is caused by the production of new load carriers and transport (upstream and downstream). Only a very small percentage comes from scope 1 and 2 and supporting activities, such as our offices.
As the potential footprint reduction in transport is obvious, it is important to emphasize there is substantial potential in footprint reduction by lowering the need to purchase new load carriers. This can be done by optimizing the usage of the existing load carrier pool (by increasing rotation speed of load carriers and by avoiding loss through digitalization and traceable load carriers) and by optimizing the life span (through proper care, repair, and maintenance). The less new load carriers we need to purchase, the less our impact on the need of timber or other materials to produce them.


We mapped all relevant GHG protocol categories in our business model, which are visualized in the overview below. In this overview we make an distinguishment between supporting activities (which are our office and employees) and the pooling activities.
One of our focus points in improving the data quality of our environmental data. To do so we are continuously working on getting more accurate and representative data. One of the ways to do is by performing an yearly internal audit team on the sustainability data, which gives us good input to continuously work on data quality improvements. Last year we improved our data based on the LCAs we have performed, also our base year calculations have been slightly adjusted based on these renewed insights.

Scope 3: All other indirect emissions. Emitted in the value chain of the organisation. A distinction is made between upstream and downstream emissions.
Scope 2: Indirect emissions. The carbon emissions that are caused by generating electricity that we purchase and use in our own office buildings or company cars.
Scope 1: The direct emissions. These emissions are generated by our office buildings and company cars. Examples are gas usage for heating and fuel consumption of company cars.
Our impact
The last three years we have measured our groupwide footprint for all three scopes of the Greenhouse Gas Protocol (GHG). Next we are also working on the quantification of our Scope 4, this is being done with the support of comparative Life Cycle Assessments of our main load-carrier services. The results of these LCA’s can be found in chapter 4 of this report.